performance analytics Data is everywhere. Your sales system logs every order, website tracks every click, and customer support tools store every interaction. Studies even show that companies using data effectively boost productivity by more than 5% and profitability by over 6%.
And yet many teams still rely on gut feeling.
That gap—between all the data you have and the decisions you still make on instinct—is exactly where performance analytics steps in. It helps you connect effort to outcomes, see what’s really working, and stop guessing your way through important choices.
More than 70% of business leaders say data helps them make faster decisions. But the real magic isn’t the numbers themselves—it’s turning those raw numbers into clear, usable insights.
If you’re new to performance analytics, this guide will walk you through what it is, why it matters, how it works, and how you can start using it step by step, without needing a data science degree.
What Is Performance Analytics?
Think of performance analytics as a reality check for your business.
Instead of asking, “How do we feel things are going?”, you ask, “What does the data say?”
In simple terms, performance analytics is the practice of measuring, tracking, and analyzing results using data to understand how:
-
Your systems perform
-
Your teams operate
-
Your strategies play out over time
It doesn’t rely on opinions or office politics. It relies on facts.
You:
-
Track activities
-
Compare them with your goals
-
Spot trends, patterns, and outliers
-
Use those insights to improve
The core purpose is straightforward: continuous improvement. When teams see accurate, timely information about performance, they can act with confidence instead of doubt.
And it’s not limited to one department. You can apply performance analytics to:
-
Operations
-
Finance
-
Sales and marketing
-
IT and infrastructure
-
HR and people management
-
Digital products and platforms
Different teams, same goal: use data to drive better results.
Why Is Performance Analytics So Important?
Modern business moves fast. Customer expectations change overnight. Costs swing. Competitors launch new offerings. Technology evolves constantly.
If you rely only on intuition in that environment, you’re flying blind.
Here’s why performance analytics has become non‑negotiable.
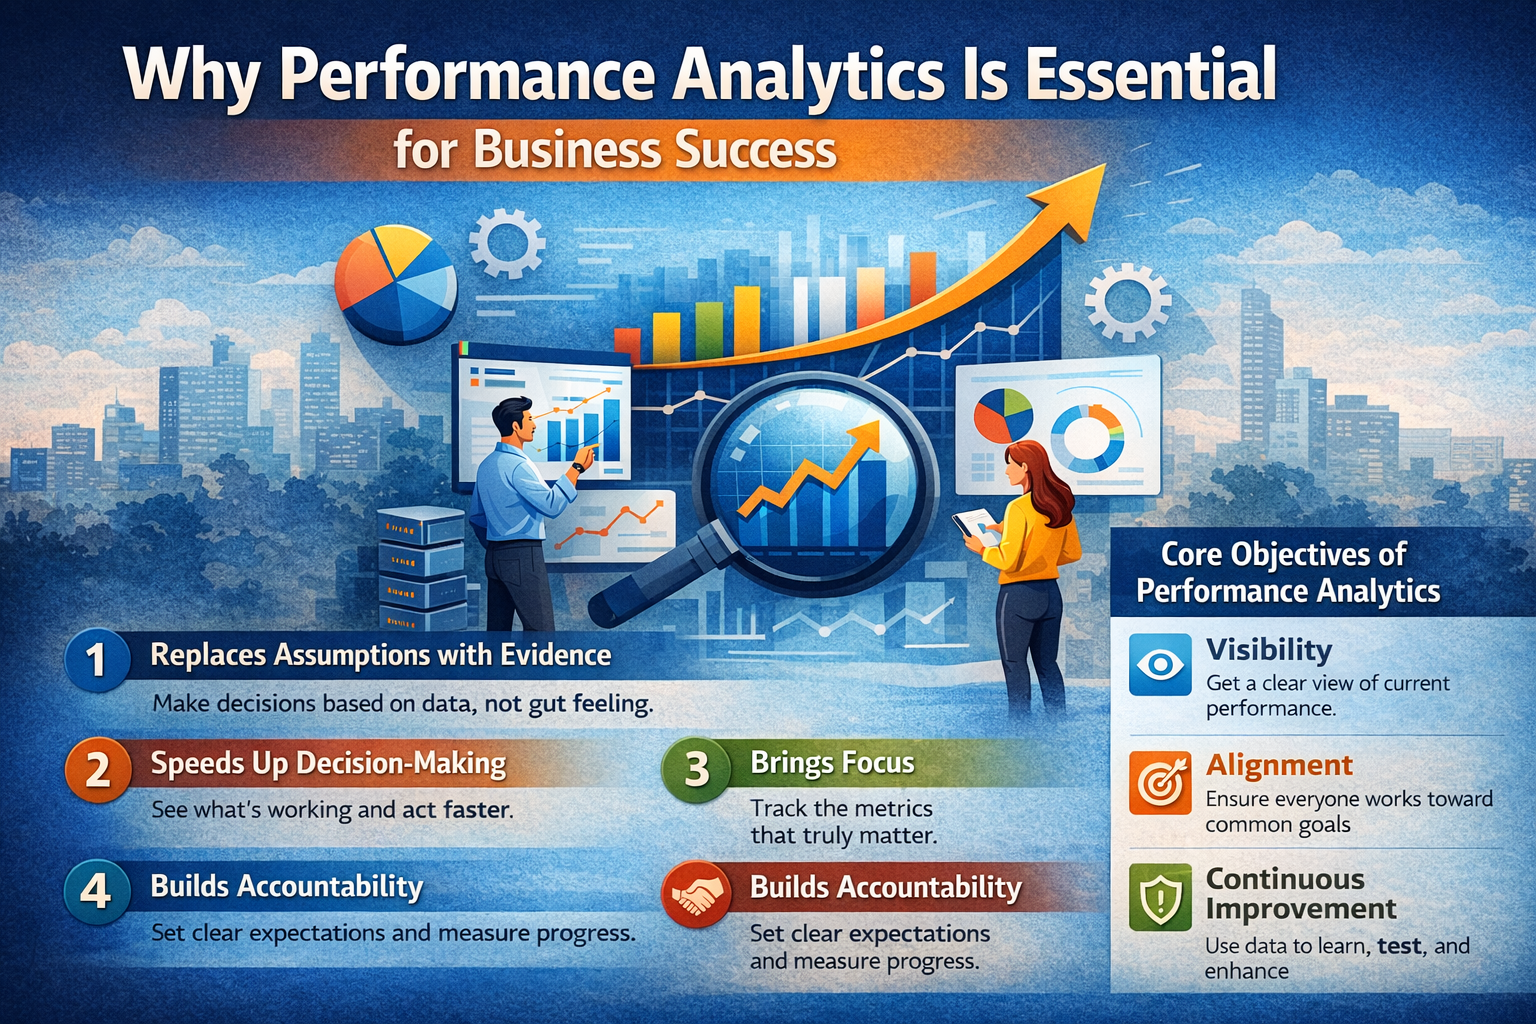
1. It Replaces Assumptions with Evidence
Instead of debating opinions in a meeting, you can look at the numbers:
-
Which product line is actually growing?
-
Which channel really brings the highest‑value customers?
-
Is customer satisfaction improving, or are we just hoping it is?
Data doesn’t care who has the loudest voice. It levels the playing field and pushes you toward reality.
2. It Speeds Up Decision‑Making
When relevant performance data is visible and up to date, you don’t have to wait weeks for reports or “check with five teams.”
You can:
-
Spot problems early
-
Confirm which actions are working
-
Decide faster, with less hesitation
In competitive markets, speed is often the difference between winning and losing.
3. It Brings Focus
There’s no shortage of metrics you could track. The danger is tracking everything and understanding nothing.
Performance analytics helps you:
-
Prioritize what truly matters
-
Align metrics with business goals
-
Stop chasing vanity numbers that don’t drive outcomes
In other words, you move from “we monitor 200 KPIs” to “we track 10 that actually matter.”
4. It Builds Accountability Without Micromanaging
When performance is visible, expectations become clear.
-
Teams know what success looks like
-
Leaders can monitor progress without hovering
-
Reviews become about facts, not feelings
This strengthens trust and alignment while still holding everyone to a fair standard.
Core Objectives of Performance Analytics
So what exactly are you trying to achieve when you invest in performance analytics? Let’s break it down.
1. Visibility
First, you want a clear picture of how things are going right now.
-
Are we on track to hit our targets?
-
Which teams are overperforming or underperforming?
-
How far are we from our goals?
Without visibility, you’re guessing. With it, you’re in control.
2. Alignment
Performance analytics helps connect daily tasks to big‑picture strategy.
When people can see how their work:
-
Affects revenue
-
Impacts customer satisfaction
-
Contributes to long‑term goals
they naturally align their decisions and effort with what truly matters.
3. Continuous Improvement
Analytics isn’t about judging—it’s about learning.
You use data to:
-
Identify strengths you can double down on
-
Spot gaps you need to fix
-
Test different approaches and see what works
Over time, this creates a culture where improvement is ongoing, not a once‑a‑year initiative.
4. Risk Reduction
Early warning signs live in your data.
-
Slipping conversion rates
-
Rising costs
-
Slower delivery times
-
Increasing error rates
Performance analytics helps you catch these signals before they turn into serious problems. That protects your revenue, resources, and reputation.
How Does Performance Analytics Actually Work?
At a high level, performance analytics follows a simple cycle: collect → analyze → interpret → act → repeat.
Let’s walk through it in plain language.
1. Collect Data from Multiple Sources
You start by gathering relevant data from:
-
Customer interactions (support tickets, calls, chats, emails)
-
Operational systems (production, logistics, inventory)
-
Digital platform (website, app, social media, CRM)
This raw data on its own doesn’t tell a story yet—but it’s the fuel.
2. Analyze Using Tools and Visualizations
Next, you process and analyze the data using:
-
Dashboard
-
Report
-
Charts and graph
-
Analytics tools and platform
Here, you’re looking for:
-
Trends over time
-
Spikes and drop
-
Relationships between different metric
Things that were invisible in a spreadsheet start to jump out visually.
3. Interpret the Results
This is where humans come in.
Managers and analysts review the findings to:
-
Identify key performance indicators (KPIs) that really matter
-
Compare actual performance against goals or thresholds
-
Understand what’s working and what isn’t
This stage uncovers both bright spots and weak areas.
4. Make Data‑Backed Decisions
Armed with insights, you can:
-
Adjust strategies
-
Reallocate resources
-
Fix broken processes
-
Double down on successful initiatives
Instead of basing decisions on “I think,” you base them on “The data shows.”
5. Monitor Continuously and Refine
Performance analytics isn’t a one‑time project. It’s an ongoing loop.
-
You keep monitoring key metrics
-
You respond to changes in the market and customer behavior
-
You update targets and strategies as needed
This continuous cycle helps your business stay agile and competitive.
In short, performance analytics turns data from a passive asset into an active strategic tool for smarter decisions, smoother operations, and more sustainable growth.
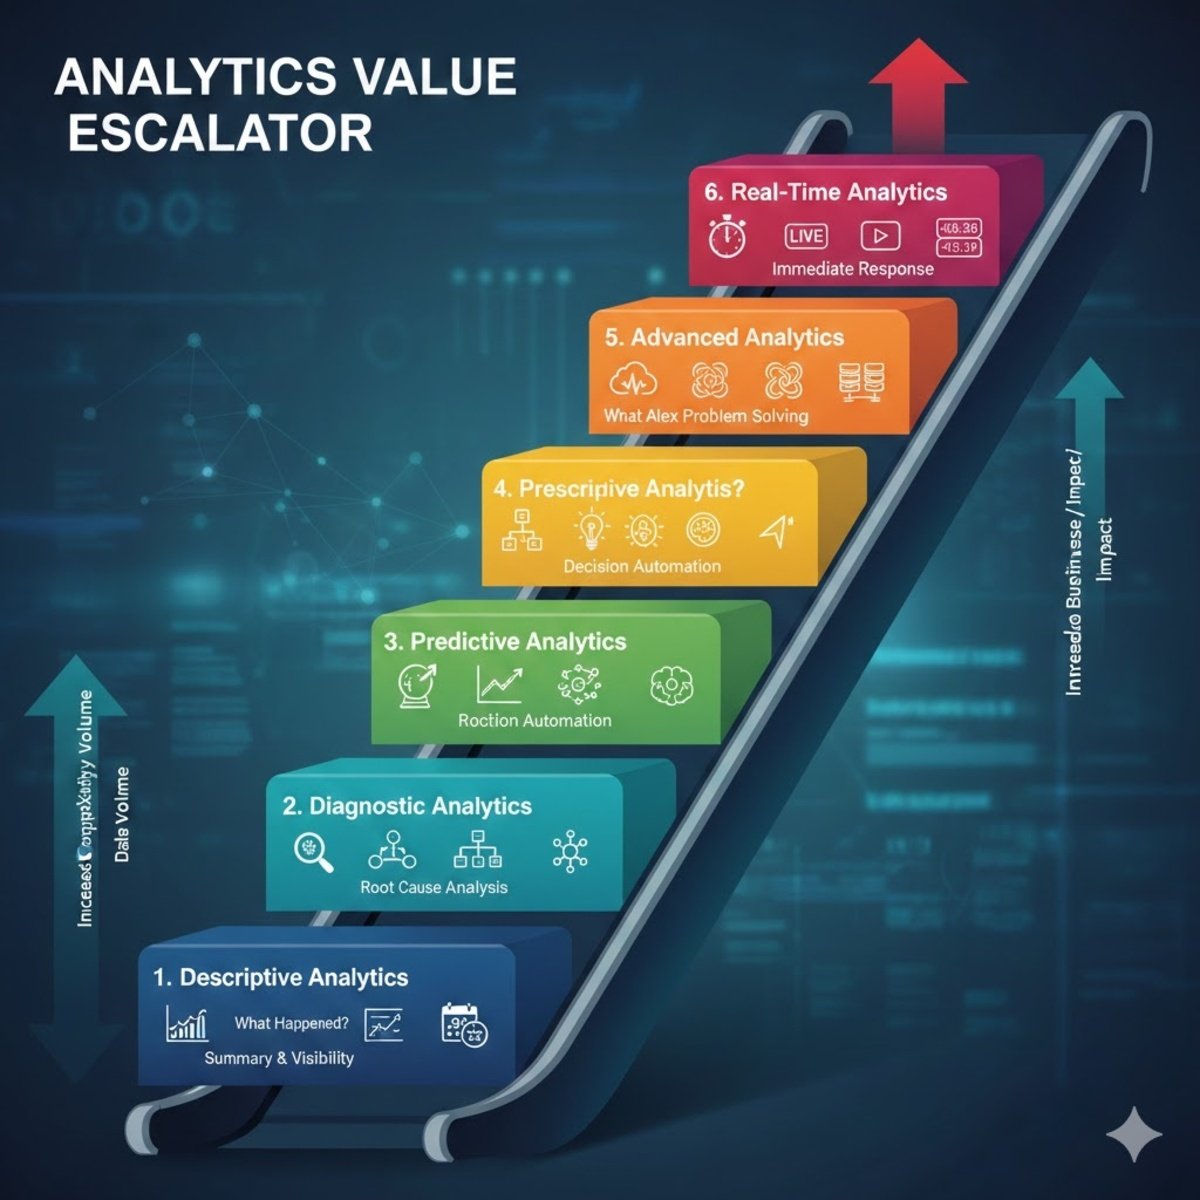
Types of Performance Analytics (And What They’re Good For)
Not all analytics is the same. Different types answer different questions. When you understand these types, you can use the right one for the job instead of using one hammer for every nail.
1. Descriptive Analytics: “What Happened?”
This is your starting point.
Descriptive analytics looks at past data and summarizes it in reports or dashboards:
-
Last month revenue
-
Quarterly website traffic
-
Year‑over‑year growth
It doesn’t tell you why things happened. It just tells you what happened in a clear, structured way.
2. Diagnostic Analytics: “Why Did It Happen?”
Once you know what happened, the next question is why.
Diagnostic analytics digs deeper into your data to uncover:
-
Causes behind performance changes
-
Relationships between different variables
-
Root reasons for spikes or drops
For example: revenue fell last quarter—was it lower traffic, fewer leads, higher churn, or all of the above?
3. Predictive Analytics: “What Might Happen Next?”
This is where things start feeling a bit like having a crystal ball—without the mysticism.
Predictive analytics uses:
-
Historical data
-
Pattern and trend
-
Statistical models or machine learning
to forecast what’s likely to happen in the future.
You might predict:
-
Future demand for a product
-
Expected churn rates
-
Sales next quarter
That way, you’re not just reacting—you’re preparing.
4. Prescriptive Analytics: “What Should We Do?”
Prescriptive analytics goes one step further.
It takes insights from descriptive, diagnostic, and predictive analytics and suggests:
-
The best next actions
-
Optimal decisions under certain conditions
-
The likely impact of different choices
For example: “To hit your target, you should increase marketing spend in this region and shift budget away from that channel.”
5. Advanced Analytics: “What Are We Missing?”
Advanced analytics deals with complex, large‑scale data.
It often involves:
-
Sophisticated statistical models
-
Machine learning algorithms
-
Big data processing
This type is especially useful for organizations with huge data volumes and complex operations, where simple reporting isn’t enough.
6. Real‑Time Analytics: “What’s Happening Right Now?”
Real‑time analytics gives you a live view of performance.
-
Website visitors on your site right now
-
Current server load
-
Live sales or transaction activity
In fast‑moving environments—like e‑commerce, logistics, or financial markets—being able to react in minutes (not weeks) can mean the difference between preventing a loss and missing the chance.
Key Performance Indicators (KPIs): The Heart of Performance Analytics
If performance analytics is your engine, Key Performance Indicators (KPIs) are your dashboard.
KPIs are specific, measurable indicators that show how well you’re doing against your goals. They’re not just “numbers”—they’re signals.
Why KPIs Matter So Much
-
They give you a clear way to measure progress
-
They highlight weak spots that need attention
-
They show which strategies work and which don’t
-
They align employee efforts with organizational goals
When employees know which KPIs they’re responsible for, they can focus their energy. Recognizing and rewarding teams for meeting KPIs also reinforces a high‑performance culture.
Common KPI Examples in Performance Analytics
-
Revenue: Total money your company earns over a specific period.
-
Profit: Revenue minus costs—how much you actually keep.
-
Customer satisfaction: Often measured via CSAT scores, NPS, or feedback surveys.
-
Employee satisfaction: How your workforce feels about their roles and the company.
-
Productivity: Output versus input—for example, output per employee or per hour.
The key is to choose KPIs that are:
-
Relevant to your goals
-
Measurable and reliable
-
Understandable to your teams
Benefits of Performance Analytics for Your Business
When you implement performance analytics properly, you unlock a long list of benefits. Let’s break down the big ones.
1. Improved Visibility Across Operations
Performance analytics gives managers and leaders a clear, up‑to‑date view of what’s happening across:
-
Team
-
System
-
Processes
You can quickly see:
-
What’s performing well
-
What’s lagging behind
-
Where work is getting stuck
That clarity is the foundation for every other benefit.
2. Truly Data‑Driven Decision‑Making
Instead of making big calls based on intuition or incomplete information, you rely on accurate data.
Analytics helps you:
-
Spot trends and patterns in behavior
-
Test hypotheses with real number
-
Reduce the risk of costly mistake
You won’t remove all uncertainty, but you’ll massively reduce guesswork.
3. Higher Operational Efficiency
Performance analytics shines a light on inefficiencies:
-
Bottlenecks in workflows
-
Redundant steps in processes
-
Areas where resources are wasted
Armed with this insight, you can streamline operations, increase output, and make better use of time and budget.
4. Stronger Accountability and Fair Evaluation
Transparent metrics mean everyone knows:
-
What’s expect
-
How success is measure
-
How performance will be review
This promotes responsibility and fairness. Performance discussions are grounded in data, not vague impressions.
5. Support for Continuous Improvement
Because performance analytics involves ongoing monitoring, it naturally supports continuous improvement.
You can:
-
Try changes
-
Measure impact
-
Adjust again
This steady feedback loop helps you stay competitive and resilient in changing markets.
6. Better Alignment with Business Goals
When performance metrics tie directly to strategic objectives, every team pulls in the same direction.
This leads to:
-
Clearer communication
-
Fewer conflicting priorities
-
Consistent progress across departments
In other words, analytics turns strategy from a slide deck into day‑to‑day behavior.
7. Faster Response to Change
When something shifts—market conditions, customer needs, internal performance—analytics helps you see it quickly.
-
You notice dips or spikes early
-
You investigate causes faster
-
You respond before issues escalate
That agility is a major competitive advantage.
Challenges of Performance Analytics (And How to Handle Them)
Of course, performance analytics isn’t magically easy. There are real challenges you need to manage.
1. Data Quality Issues
If your data is:
-
Incomplete
-
Inaccurate
-
Outdated
your insights will be misleading. “Garbage in, garbage out” definitely applies here.
Fix: Clean your data, standardize formats, and set rules for data entry and maintenance.
2. Integration Between Systems
Different systems—CRM, ERP, HR, finance—often store data in different formats and silos. That makes it hard to get a unified view.
Fix: Use integration tools, data warehouses, or analytics platforms that pull information from multiple sources into one place.
3. Skills and Interpretation Gaps
Even with the right data, teams may struggle to:
-
Read dashboards correctly
-
Understand what metrics actually mean
-
Translate insights into actions
Fix: Provide training on basic analytics concepts and tools. Encourage collaboration between analysts and business leaders.
4. Cultural Resistance
Moving from intuition‑based decisions to data‑driven ones can feel uncomfortable.
-
People may fear being measured
-
Managers may resist changing their style
-
Teams may distrust “numbers” at first
Fix: Lead from the top. Communicate clearly that analytics is about improvement, not punishment. Show early wins to build trust.
Performance Analytics vs. Performance Appraisals
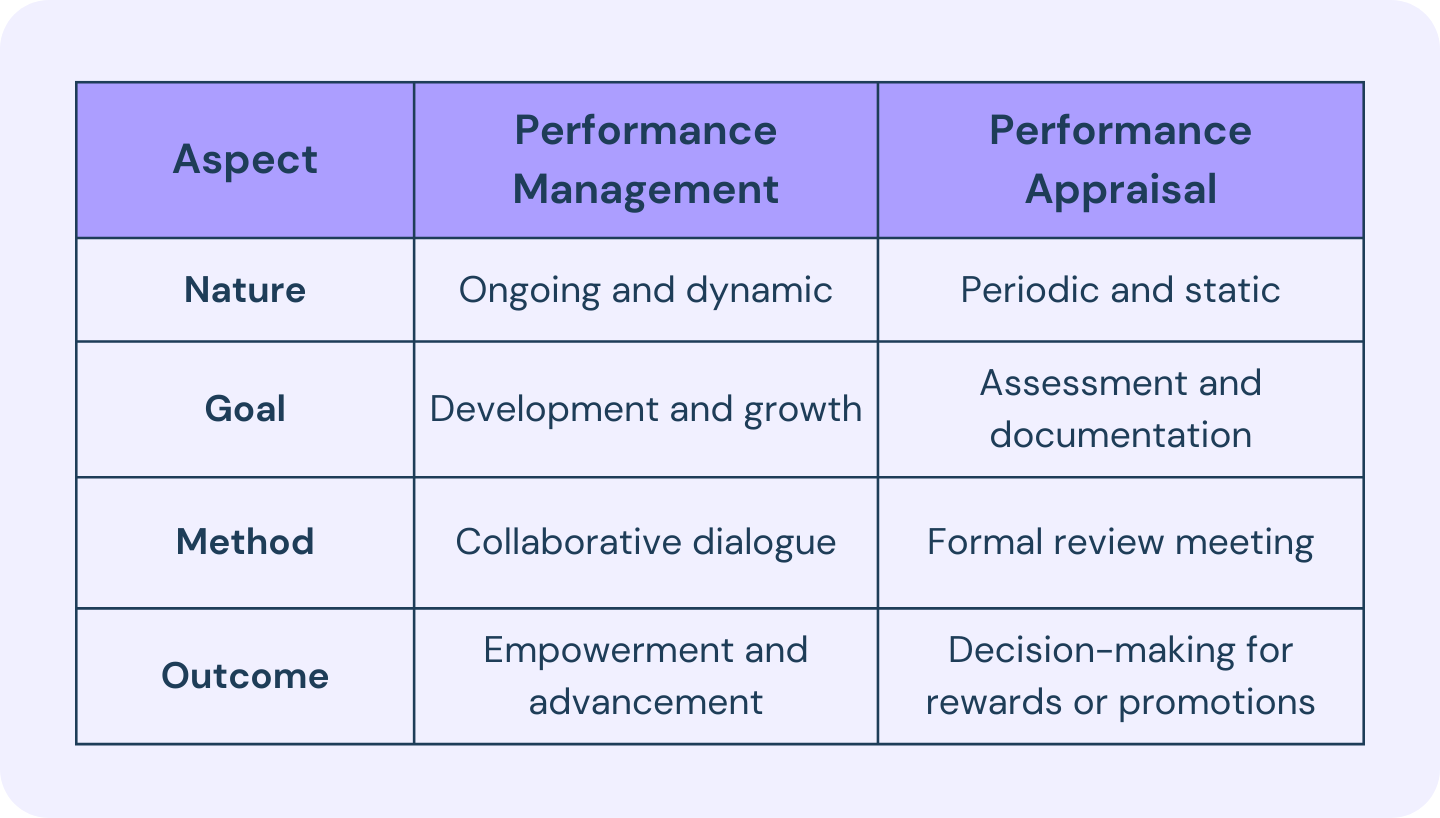
These two terms sound similar, but they serve very different purposes.
-
Performance analytics looks at business processes, systems, and outcomes.
-
Performance appraisals focus on individual employee performance.
Here’s the distinction in plain language:
-
Performance analytics is about: “How is our business performing?”
-
Performance appraisals are about: “How is this person performing?”
Analytics uses operational, financial, and system data—usually continuously. Appraisals are periodic, often based on manager feedback, and more subjective.
Both matter, but they solve different problems.
Traditional Performance Reviews vs. Performance Analytics
Traditional performance reviews:
-
Happen once or twice a year
-
Rely heavily on manager opinions
-
Focus on past behavior
Performance analytics, on the other hand:
-
Monitors performance continuously
-
Relies on data and trends
-
Helps you act proactively, not just react
The takeaway? Traditional reviews can still have a place for development and feedback—but analytics gives you a more objective, ongoing, and strategic view of performance.
How to Execute Performance Analytics in Your Organization
Let’s move from “what” and “why” to “how.” How do you actually roll out performance analytics in a real business?
1. Start with Clear Objectives
Don’t start with tools. Start with questions.
Ask:
-
What do we want to improve?
-
Productivity? Engagement? Customer satisfaction? Revenue growth?
-
Which decisions do we want better information for?
A sharp purpose leads to meaningful analytics instead of random dashboards.
2. Define a Simple Workflow
Clarify:
-
Who collects data
-
Who maintains and integrates it
-
Who analyzes it
-
Who receives insights and acts on them
When everyone knows their role, the process runs smoothly instead of becoming a chaotic side project.
3. Choose the Right KPIs
Select KPIs that:
-
Align with your business goals
-
Are measurable and reliable
-
Make sense to managers and teams
Avoid the temptation to track everything. Start small and expand as you mature.
4. Secure Reliable Data Sources
Identify where your data will come from:
-
HR systems
-
CRM platforms
-
Finance tools
-
Operations software
Ensure consistency and accuracy. If you don’t trust your data, you won’t trust your analytics.
5. Get Buy‑In from Leaders and Teams
Explain:
-
Why you’re introducing performance analytics
-
How it helps teams, not just management
-
What will and will not be measured
Transparency builds trust and reduces resistance.
6. Invest in Data Quality and Integration
Make sure data is:
-
Accurate
-
Up‑to‑date
-
Secure
-
Integrated across systems where needed
Without this foundation, your analytics will be shaky.
7. Select the Right Software
Pick tools that fit your size and needs—whether that’s:
-
A full analytics platform
-
Built‑in reporting in your current systems
-
Specialized tools for finance, HR, or operations
Make sure they’re user‑friendly enough that non‑experts can use them.
8. Train Your Team
Teach managers and key staff:
-
How to read dashboards and reports
-
How to interpret trends and correlations
-
How to translate insights into action plans
The better your people understand the tools, the more value you’ll get.
9. Use Benchmarking and Trend Analysis
Compare:
-
Current performance to previous periods
-
Your results to industry standards where possible
This helps you see whether you’re actually improving or just standing still.
10. Protect Data Privacy and Security
Especially when dealing with employee or customer data, you must:
-
Limit access appropriately
-
Follow privacy regulations
-
Use secure systems and protocols
Trust and compliance are essential.
11. Plan for Scale and Automation
As you grow:
-
Choose tools and processes that can scale
-
Automate repetitive reporting and data collection
-
Keep involving your teams so adoption stays high
This ensures performance analytics becomes part of your culture, not a one‑time initiative.
Step‑by‑Step: Mastering Business Performance Analytics
If you like clear steps, here’s a straightforward roadmap you can follow.
Step 1: Set Clear Objectives
Define what you want to achieve—improve engagement, cut costs, increase productivity, reduce turnover, or something else. Be specific.
Step 2: Identify Relevant KPIs
Pick metrics that directly reflect those objectives. If you want higher productivity, what will you measure? Output per employee? Time to complete tasks?
Step 3: Collect and Integrate Data
Gather trustworthy data from reports, surveys, feedback tools, and performance systems. Connect these sources so they tell one cohesive story.
Step 4: Build Dashboards and Reports
Create simple, visual dashboards that highlight the most important metrics. Avoid clutter. Make them easy to read at a glance.
Step 5: Benchmark and Compare
Look at your performance over time and, where possible, against industry norms. Spot where you’re ahead and where you’re lagging.
Step 6: Conduct Root Cause Analysis
When you see a problem, don’t stop at the surface. Use methods like the “five whys” to uncover what’s really driving the issue.
Step 7: Analyze Performance Drivers
Talk to teams. Combine qualitative feedback with quantitative data. Understand what conditions lead to better or worse outcomes.
Step 8: Identify Trends and Patterns
Look for recurring patterns in your performance data. These often explain why results change and what you can influence.
Step 9: Plan and Implement Actions
Turn insights into action plans with clear owners and deadlines. Track whether those actions actually move the needle.
Step 10: Maintain Continuous Feedback
Keep the conversation going. Encourage teams to give feedback on metrics, dashboards, and processes. Adjust as you learn.
Popular Tools Used for Performance Analytics
The right tools make everything easier. Here are some widely used platforms across different areas of performance analytics.
ServiceNow Performance Analytics
ServiceNow Performance Analytics focuses on operational and service performance.
-
Tracks workflows and service delivery
-
Provides real‑time dashboards and historical trends
-
Helps teams spot performance gaps early
Great for IT service management and operations teams looking to improve service quality and efficiency.
SAP SuccessFactors
SAP SuccessFactors is all about workforce and HR performance.
-
Measures productivity, engagement, and goal alignment
-
Connects individual performance to business objectives
-
Highlights development needs and talent gaps
Ideal for HR teams that want to move beyond simple performance reviews to real people analytics.
Salesforce
Salesforce is a powerhouse for sales and customer analytics.
-
Tracks pipelines, deals, and revenue
-
Analyzes customer behavior and interactions
-
Provides detailed reports and dashboards
Sales and marketing teams use it to refine strategy, improve conversion rates, and understand customer journeys.
NetApp
NetApp supports infrastructure and data performance analytics.
-
Monitors system health, storage, and data availability
-
Identifies performance issues before they impact users
-
Helps optimize IT operations and capacity planning
This is especially valuable for businesses heavily dependent on stable digital infrastructure.
Microsoft Dynamics 365 Finance
Microsoft Dynamics 365 Finance delivers deep financial analytics.
-
Tracks revenue, expenses, and cash flow
-
Analyzes financial trends and forecasts
-
Aligns budgeting with strategic goals
Finance teams use it to support better planning, risk management, and profitable growth.
Real‑World Use Cases of Performance Analytics
To make it more concrete, here’s how performance analytics plays out in everyday business scenarios.
Sales Analytics
-
Tracks revenue growth, win rates, and conversion at each funnel stage
-
Highlights which products, regions, or segments perform best
-
Signals when pipelines are strong—or at risk
Sales leaders use this to refine strategy, coach teams, and prioritize opportunities.
Supply Chain Management
-
Monitors inventory levels, lead times, and delivery performance
-
Identifies unreliable suppliers or locations
-
Helps balance stock levels to reduce both shortages and overstock
This leads to lower costs, fewer delays, and smoother operations.
Website and Digital Performance
-
Measures page speed, bounce rates, session length, and conversions
-
Shows what content or pages engage users
-
Reveals where users drop off in a journey
Digital teams use this to improve user experience, boost engagement, and increase conversions.
Across these examples, the pattern is the same: data guides improvement and helps teams make smarter decisions.
Conclusion
Performance analytics isn’t about drowning in dashboards or obsessing over numbers for their own sake. It’s about using the data you already have to answer simple but powerful questions:
-
Are we doing well?
-
Why or why not?
-
What should we change next?
Start small, focus on clear goals, pick meaningful KPIs, and build from there. With the right mindset and tools, performance analytics stops being a buzzword and becomes one of the most practical, impactful habits your organization can build.